
Mapping tag clouds
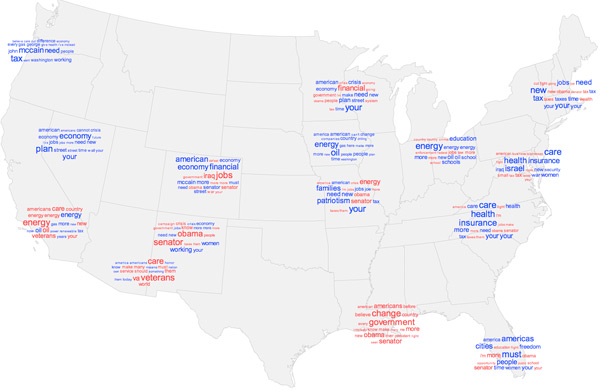
Over on the Axis Maps blog I’ve written up a side project I began several months ago but never got very far on: mapping the geography of presidential campaign speeches. It’s still an interesting idea, but my colleagues and I didn’t have the time to fully develop it, so you’ll have to settle for some screenshots.
Not wanting to simply write duplicate content here, I thought I’d say a bit about what is perhaps novel about the project, which is visualizing word frequency on a map. Word clouds or tag clouds are trendy these days, especially given a tool like Wordle that can produce a damn sexy word cloud. They’re something of a simple and elegant visualization, combining data and label in one, and they’re pretty effective. (Their drawbacks should be noted, however. See, for example, the caveats at the bottom of this Many Eyes page or Zachary “Hollywood” Johnson’s experiments with tag scaling to address a potential overemphasis on long words.)
So tag clouds are hip. I thought it would be interesting to find a way to use them in a map. Easy enough: if a collection of words is associated with a location, slap it on a map. That’s the basic idea behind the campaign speeches maps. We can see how campaign word use varies across the region. Beyond that, though, I wanted to see how the patterns look at different scales by aggregating neighboring word clouds.
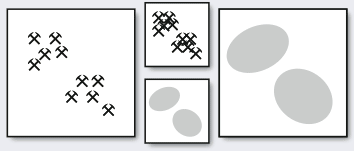
Aggregation is a basic and necessary cartographic generalization procedure wherein multiple point symbols are replaced with with a single areal symbol to represent them*. It’s a matter of scale; if you’ve got too many symbols close together to discern them at a small scale, you’re better off combining them. I’m a fan of the way EveryBlock maps have such scale-dependent symbolization. If there are too many points to show individually, they are combined into a larger symbol with a number on it. (It effectively becomes a proportional symbol map.) I wanted to do something similar with word clouds: if there were too many to fit in a given area, combine them into a single cloud encompassing words from all the individual clouds.
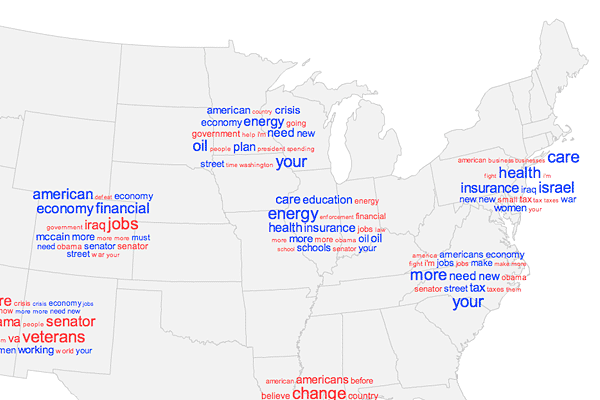
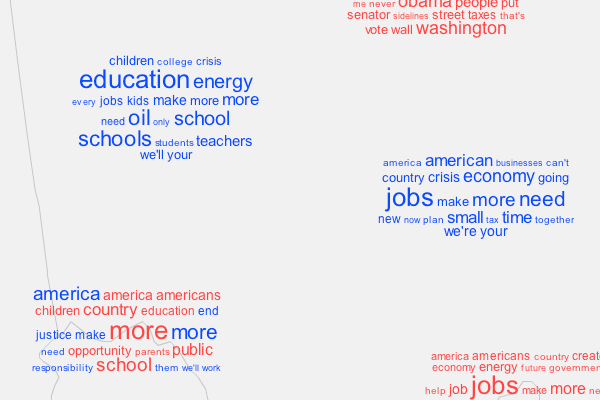
The spatial perspective it gives, then, is patterns from broad regions down to a local level. For example, zooming from the national level into my home state of Ohio on the campaign speech map, we see the word patterns for the general northeastern quadrant of the country, then the Midwest, then individual cities in Ohio.
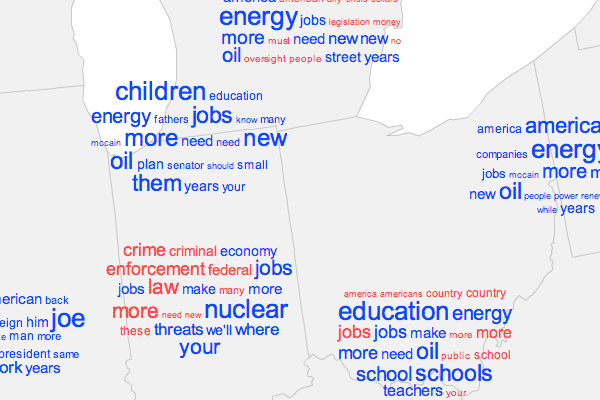
As this project became neglected, so did my interest in learning about better aggregation algorithms. Mine was pretty basic and probably inefficient. It essentially draws all the tag clouds, finds the closest pair, checks if they overlap, if so combines them into one at the average location, and then repeats the process until no more clouds overlap. Each cloud shows only as many as 20 words, and half of them are from each candidate where possible. It’s a comparison of two texts, but not in a word-for-word way that is sometimes seen, for instance here at Many Eyes.
Anyway, I think these scale-dependent tag clouds are an interesting idea to pursue further, and I’m not sure if anyone’s done it before. Other examples would be most welcome!
* Note that the technical definition of aggregation involves “increased dimensionality” (to quote my friend Robert “The Hammer” Roth in his work on the ScaleMaster project at Penn State), e.g. from points to polygon. With my word clouds it’s more like polygon-to-polygon, but not a larger polygon, which would be closer to amalgamation. I’m not sure what a generalization expert would actually call this, as it’s sort of a content operation manifested in an geometry operation.
Tagged election maps, generalization, map projects, tag clouds
3 Comments